Research
The Economics & Practicality of Terragraph:
Is Terragraph Backhaul essential for 5G?
Telecom providers are preparing for 5G with a mixture of resignation and anticipation knowing that it will unlock more than 30% in additional revenue with new 5G use cases and the widespread adoption of the Internet of Things (IoT). The majority of 5G deployments will occur at high frequency bands including 3.5GHz in Sub6GHz frequencies & 25GHz/40GHz bands in mmWave. These high frequency bands will require extensive small cell deployments driving a 4x-7x increase in site density and ~$26B spend in infrastructure spending by 2022 (IDC). In high density deployments like this an operator’s two greatest challenges will likely be site selection and backhaul. While fiber backhaul accounts for the single greatest cost driver of 5G, Terragraph,offers potentially significant backhaul savings. We put this theory to test using our digital twin to see how well Terragraph performs in a market like San Jose.
reality of 5G mmW Coverage:
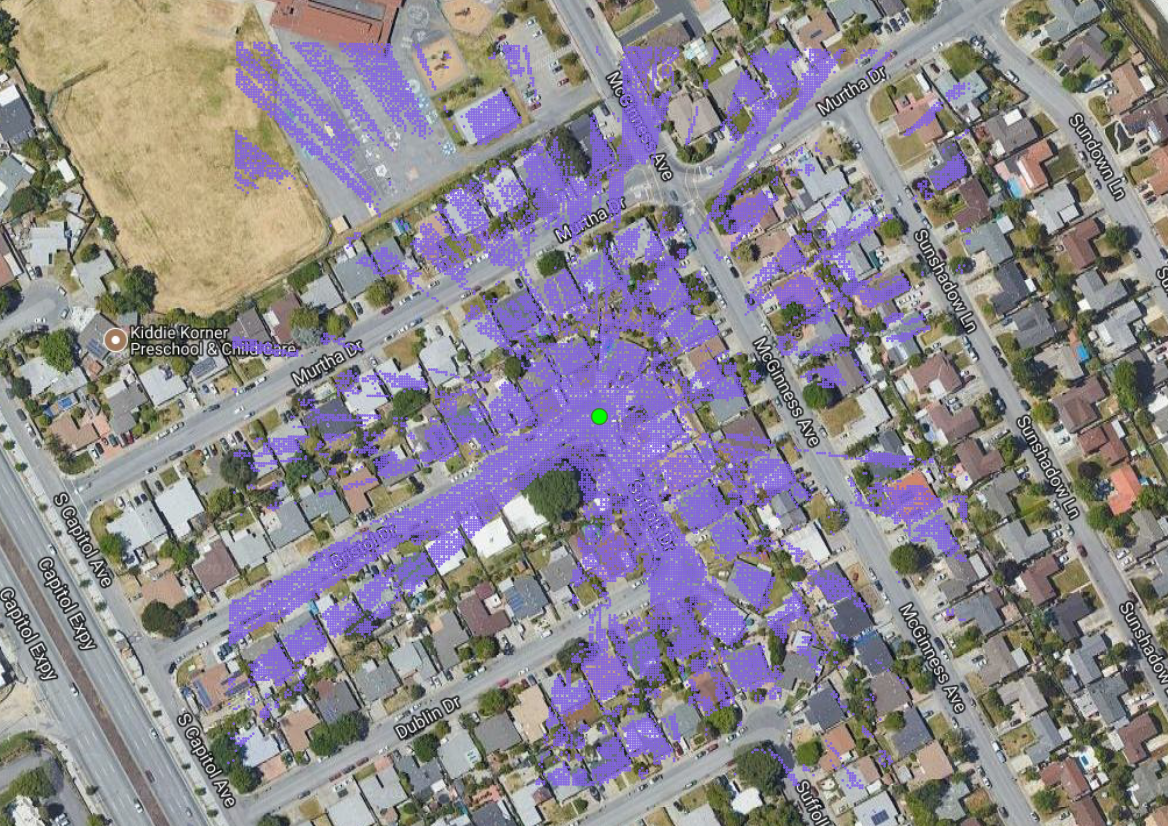
How Much Coverage Should Operators Expect?
As we head into 2019, 5G plans of opertaors like AT&T and Verizon are slowly becoming clearer, with both companies initially focused on mmWave small cell deployments on Street Lights. Over the last few years, we’ve seen many papers talk about different mmWave propagation/channel models. However, one thing lacking in all of these papers is a demonstration of what coverage from a street light deployment would actually look like. Propagation models allow us to determine pathloss in Line of Sight (LOS) , Non-Line of Sight (NLOS) & Indoor conditions This study demonstrates the type of coverage operators should expect from a street light based mmWave deployments.
fixed wireless access:

Can FWA meet our cities needs?
The very first standardized deployments of 5G FWA are expected to be commercialized in 2019; largely driven by early commercial rollouts by Verizon Communications and AT&T. In the US, 5G FWA subscriptions are expected to account for $1 Billion in service revenue by the end of 2019 alone with continued rapid growth through 2025. Carriers see increased household demand for bandwidth as a growth opportunity that may not always be economically viable to address with fiber. 5G FWA uses millimeter to provides fiber-like speeds.
One of the more challenging aspects of these networks is understanding the practicality of offering broadband access using Line of Sight (LOS) CPE locations.
MICROWAVE LOS QUALIFICATION:

is there a better way?
Traditionally microwave planning is done by sending two teams on top of the candidate sites. These teams using visual aids try to estimate line of sight between buildings. This methodology works fine when there are few sites, but it’s no longer scalable when tens of sites are involved.
One of our customers, a Tier-1 operator had a requirement to plan a microwave backhaul network between tens of buildings in a city. They needed to test out all possible combinations between a list of buildings before their network planning teams could start defining the layout. We used high resolution DSM (Digital Surface Maps) to detect the presence of any obstruction in fresnel zone of a 70GHz point-to-point link in all site combinations.
Geodemographics

HOW DO WE FIND AND BUILD FOR OUR TARGET CUSTOMER?
Geodemographic classification has traditionally been used for marketing or social research Broadly speaking, the goal is to divide customers into groups that share certain characteristics. We were approached by a fixed wireless ISP to identify target markets which aligned with their business model. The ISP wanted to target neighborhoods based on competition, available speeds, income, and a variety of environmental factors including building height and household density. We use geodemographics to explore the dynamic and diverse spatial landscape of broadband availability in the United States at the block group level.
SPECTRUM AUCTIONS
MNO cBRS auction results
Spectrum decisions can have a profound impact on coverage, capacity, user experience, and ultimately network cost; all of which are determining factors of market share. With the recent T-Mobile + Sprint Merger and whirlwind of mmWave, CBRS, C-Band, and L-Band spectrum opportunities we are witnessing the largest re-shuffling of market power in recent telecom history.
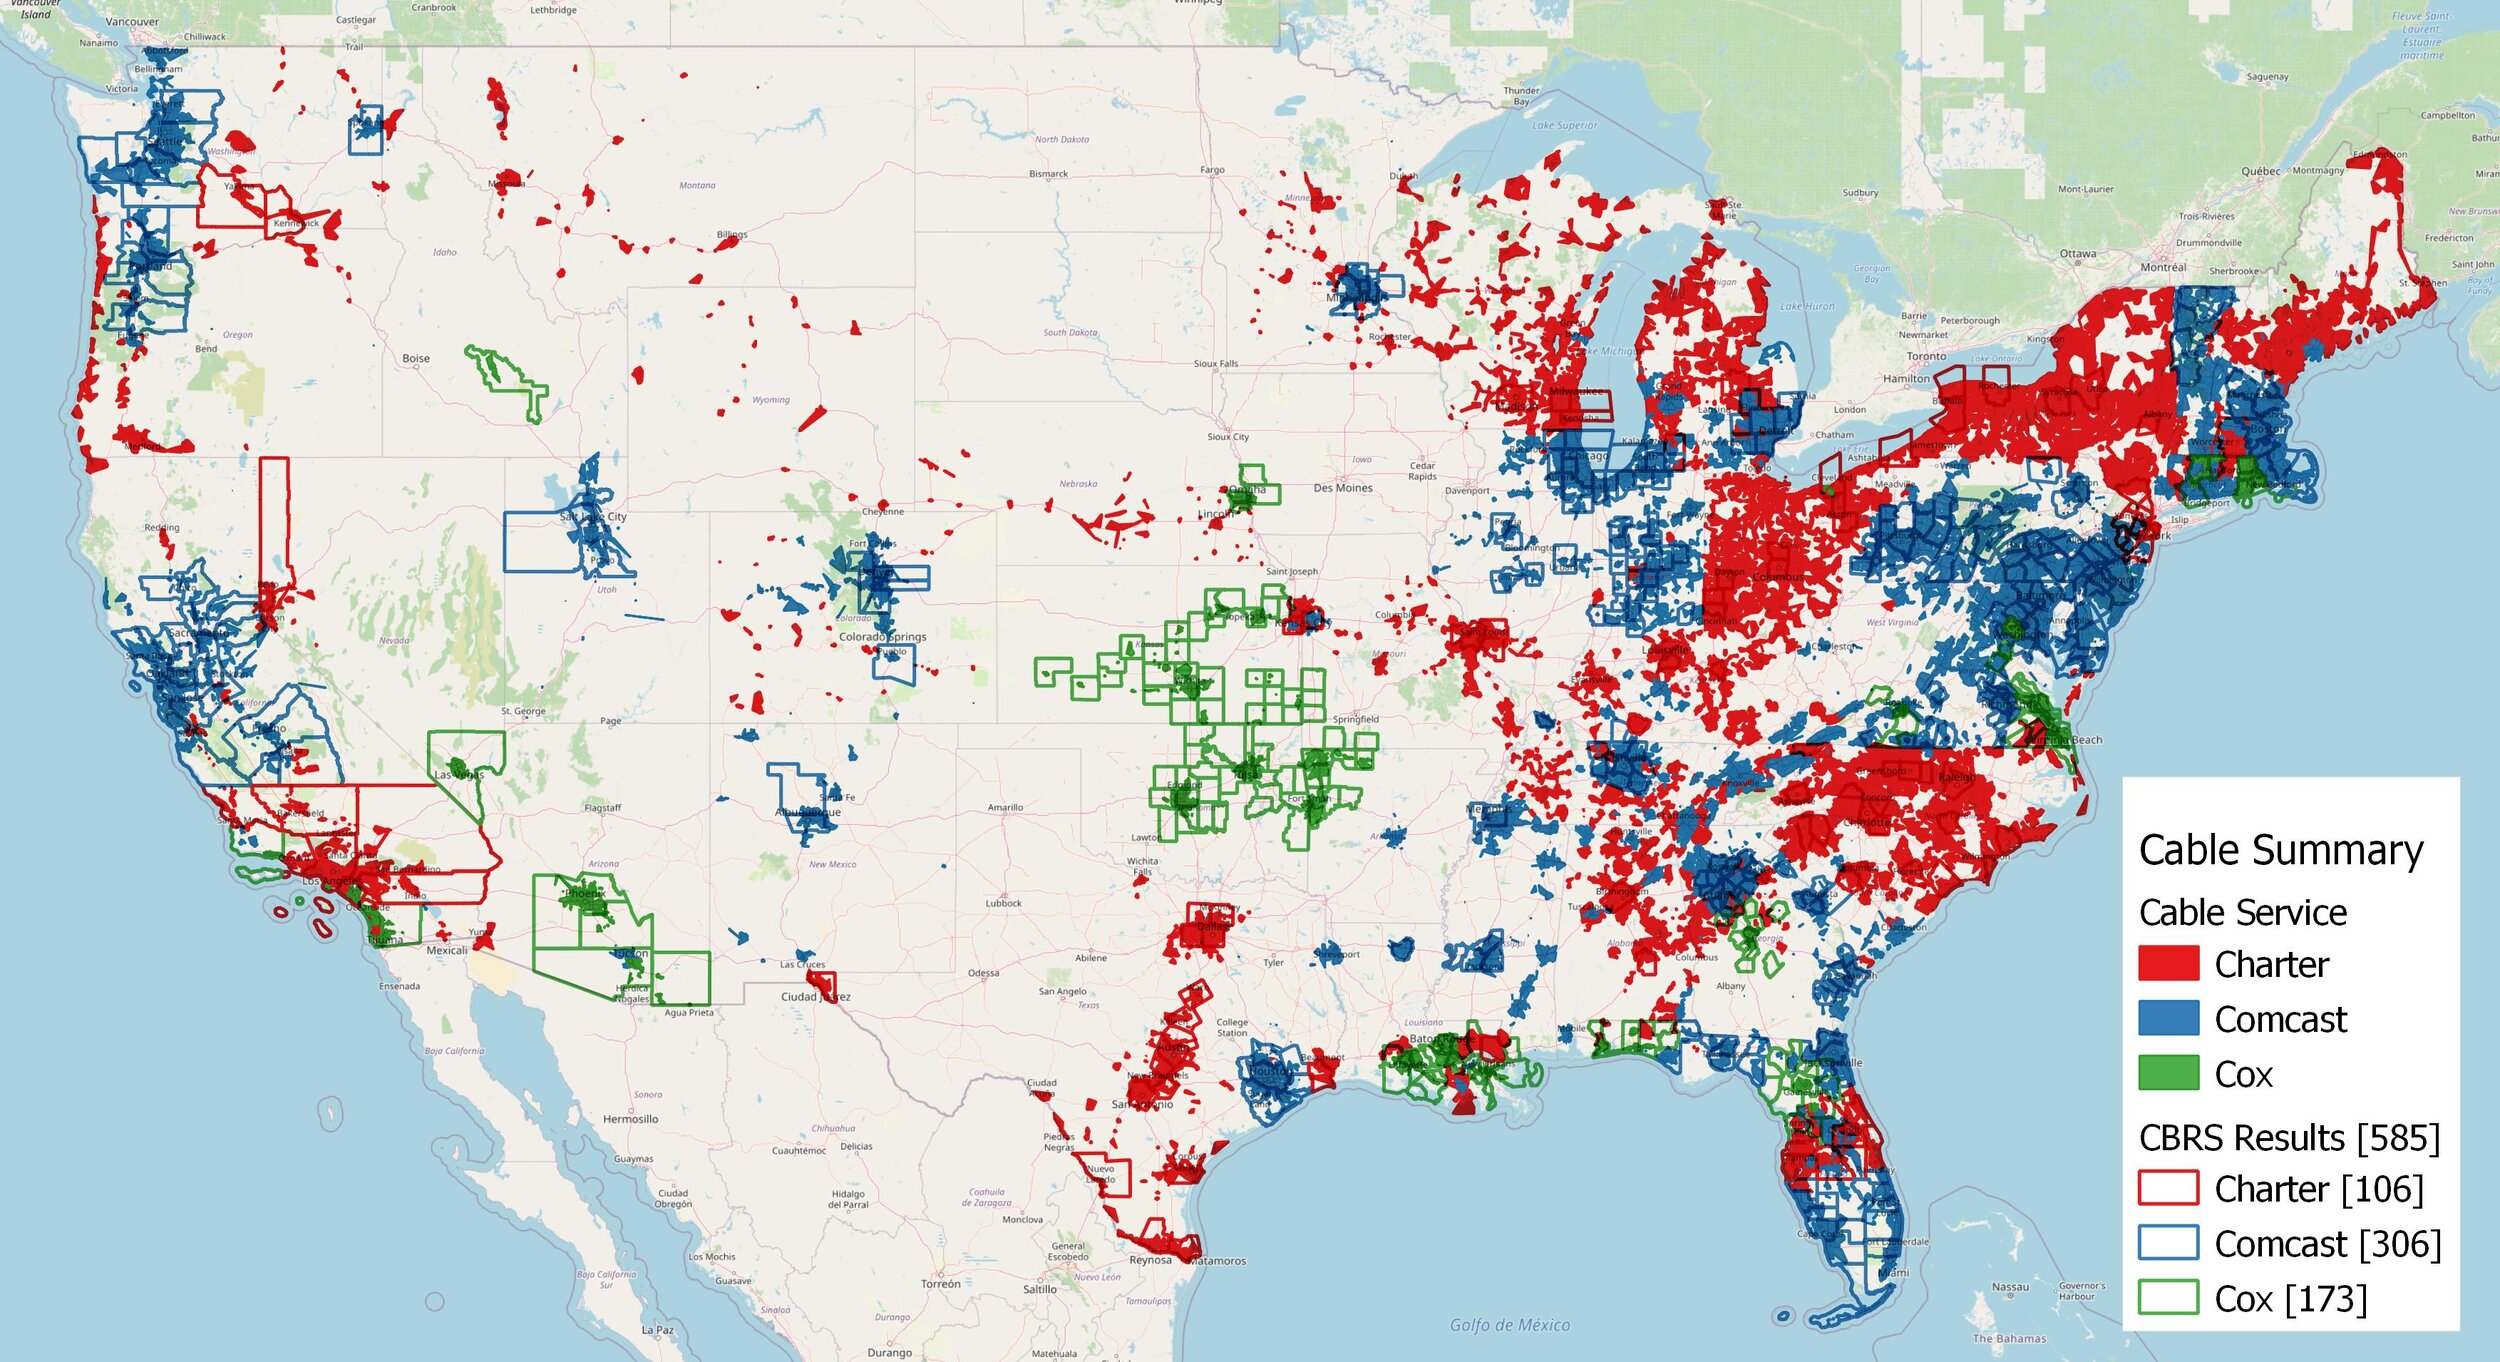
Cable cBRS auction results
After the close of the CBRS auction a lot of attention has been given to Verizon and Dish and the subsequent impact on the pending C-Band auction. However, the threat of cable companies is often dismissed even though Cox, Comcast, and Charter rounded out the list of top 5 bidders.

C-Band auction strategy & Analysis
Global mobile Suppliers Association have called the C Band “– the most important spectrum band for 5G.” With the recent T-Mobile + Sprint merger and the completion of the CBRS auction attention shifts to C-Band. In the attached article we outline our approach to auction valuation, competitive bidding simulation, and ultimately final results.